

Calgary Map for PowerPoint and Google Slides
Calgary Map for PowerPoint and Google Slides
(5 Editable Slides)
Related Presentation Templates


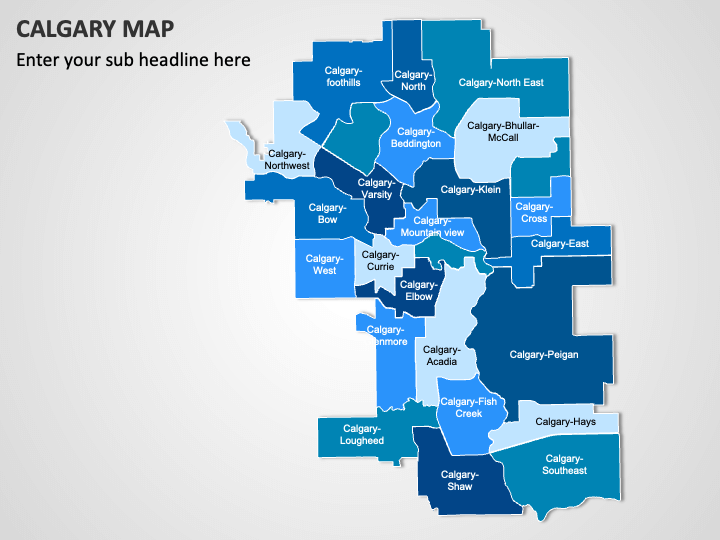
Grab our Calgary Map template for PowerPoint and Google Slides to make the information about Calgary more accessible and engaging. Business and market analysts can use this set to illustrate the city’s market conditions regarding a new business establishment or expansion. City planners and researchers can use this deck to display demographic information, such as population density, age distribution, income levels, etc. Government agencies can portray key economic zones and industrial areas in the city, highlighting opportunities for investment and development. Real estate developers can illustrate housing trends, property values, and development projects in different neighborhoods of Calgary. You can also depict tourist attractions, cultural and recreational spaces, education and healthcare facilities, and more.
The slides comprise
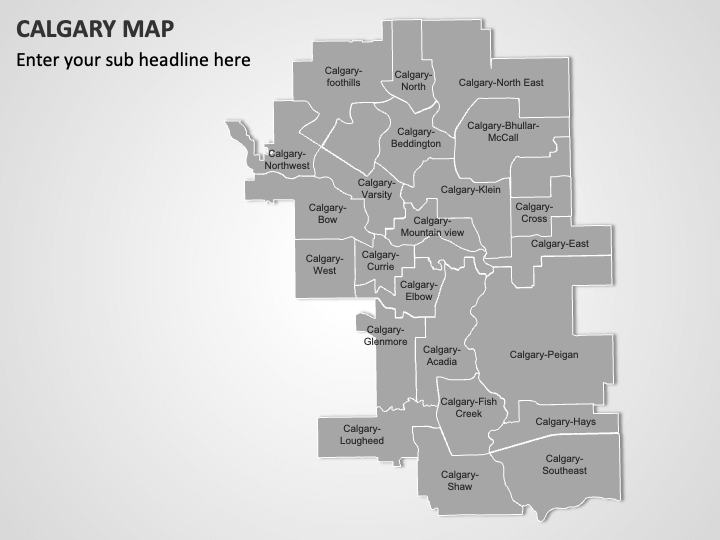
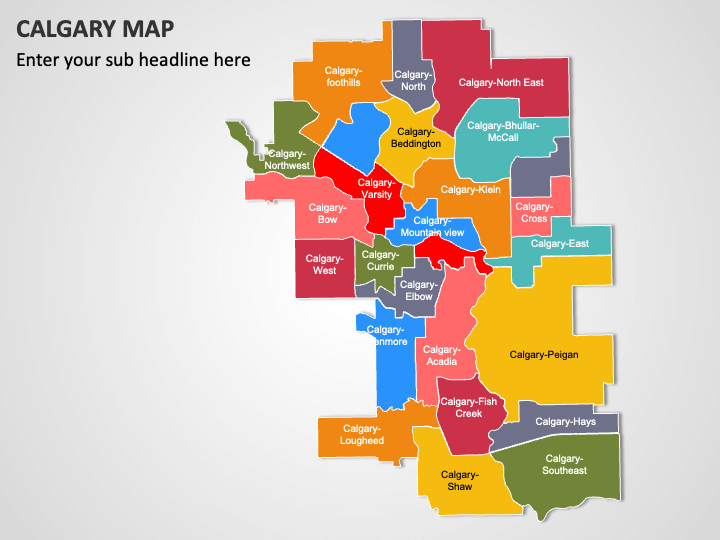
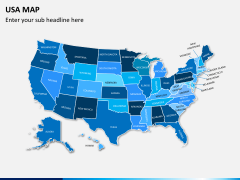
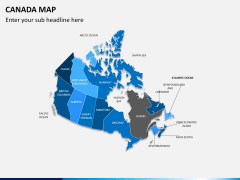
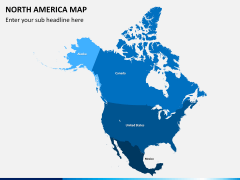
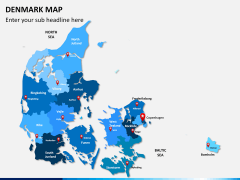
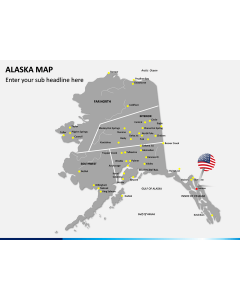
- Geographical map illustrations to display the city’s major regions.
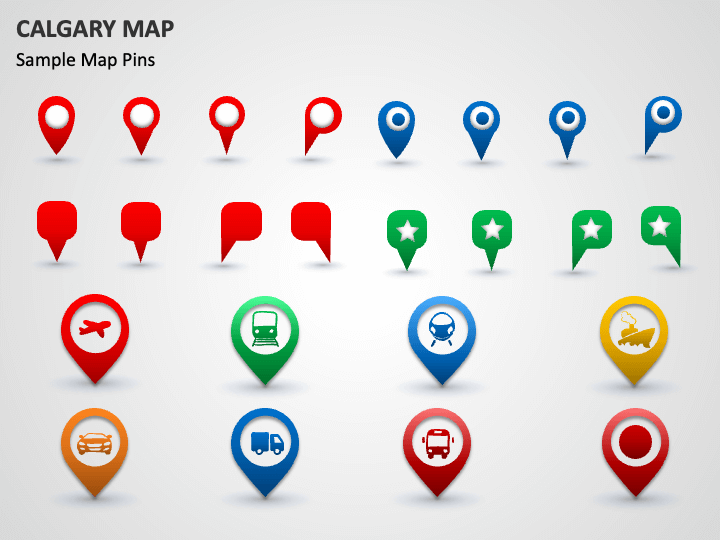
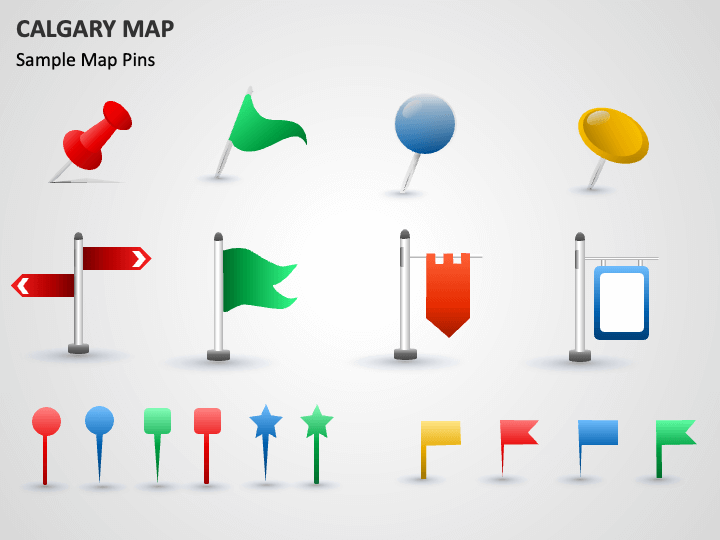
- GPS and map pin icons to accentuate information about the city’s transportation infrastructure.
- Icons of clouds with the sun, rain droplets, and thunderstorms to visualize weather and climate patterns in the city.
Features
- Customize the visuals to align with your presentation’s theme without confronting challenges.
- The graphic quality and resolution will remain constant, even when projected on a widescreen dimension.
- Our designers have thoughtfully designed the set to eliminate the room for copyright issues.
Download this graphic-rich PPT right away!