
Data Infographics for PowerPoint and Google Slides
(11 Editable Slides)
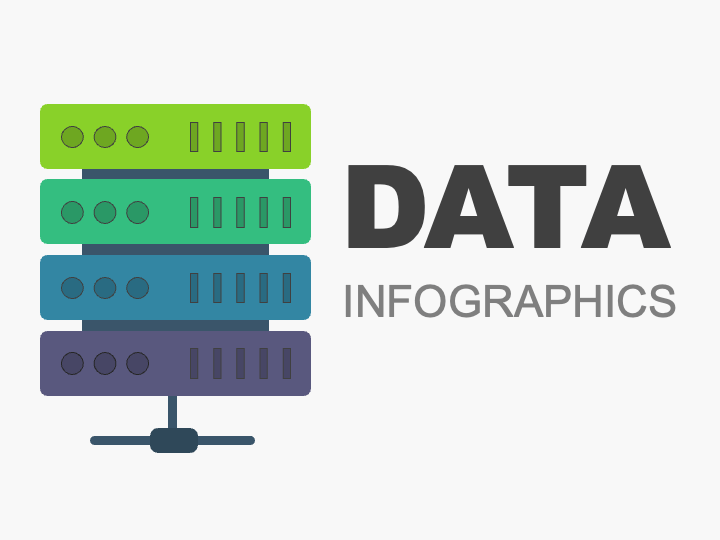

Data Infographics for PowerPoint and Google Slides

SB16681
Available For


Similar Products
- Sale

Revenue Projection Infographics PowerPoint and Google Slides Template
(13 Editable Slides)
- Sale
- Sale
- Sale
- Sale
- Sale


Use our Data Infographics for PowerPoint and Google Slides to showcase valuable insights about your data in easily digestible parts. Data scientists can leverage this deck to depict data analysis to help businesses understand, interpret, and predict user behavior and market trends and make necessary adjustments to strategies. IT professionals can use these graphics to highlight data types, processing techniques, etc. Cybersecurity experts can use this graphic-rich set to display best practices for securing data stored in digital assets. Researchers and analysts can also use these illustrations to present data insights of a specific analysis.
A Quick Look at the Template’s Design
- A compelling cover slide is provided to help you start your presentation more effectively.
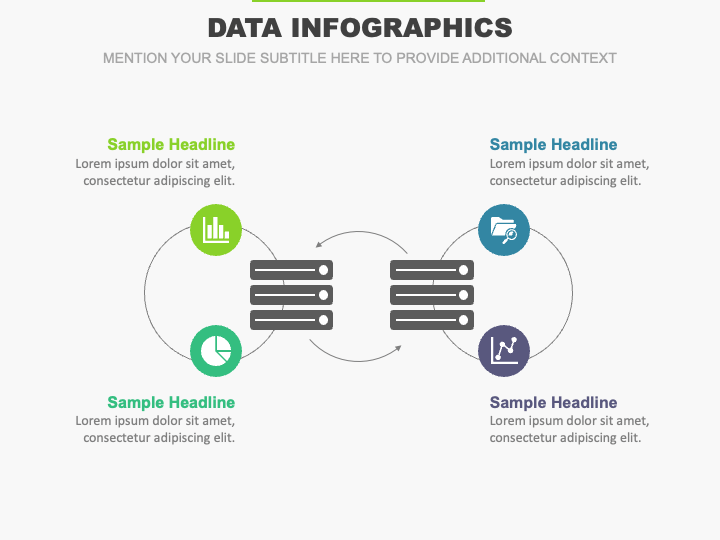
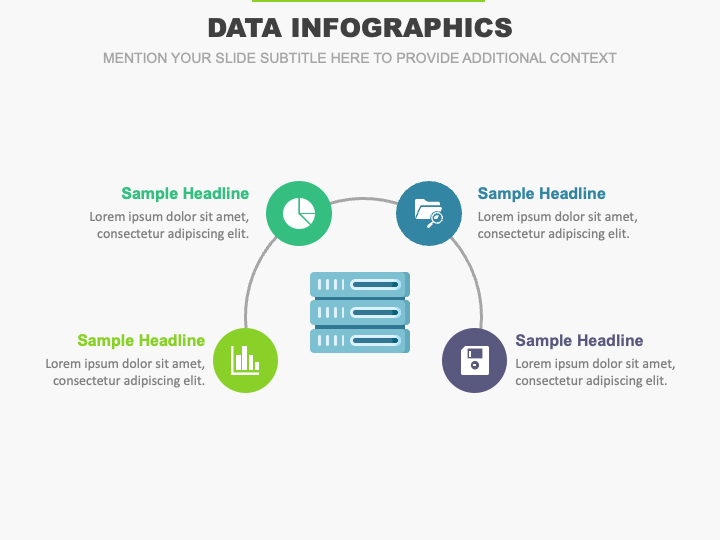
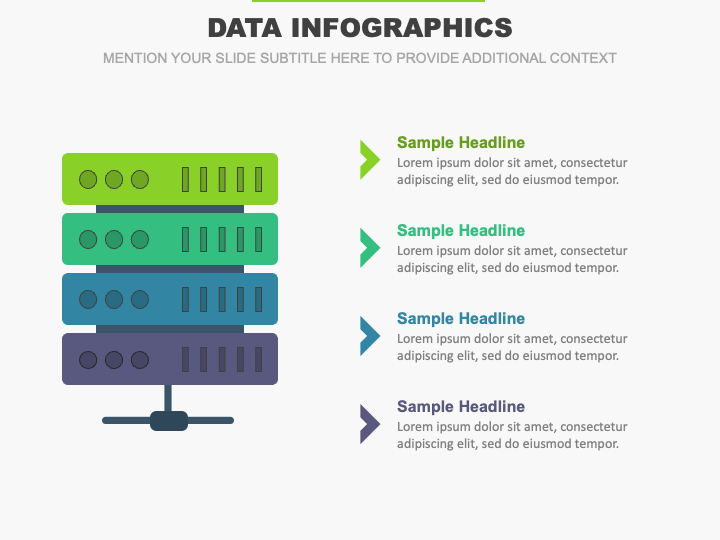
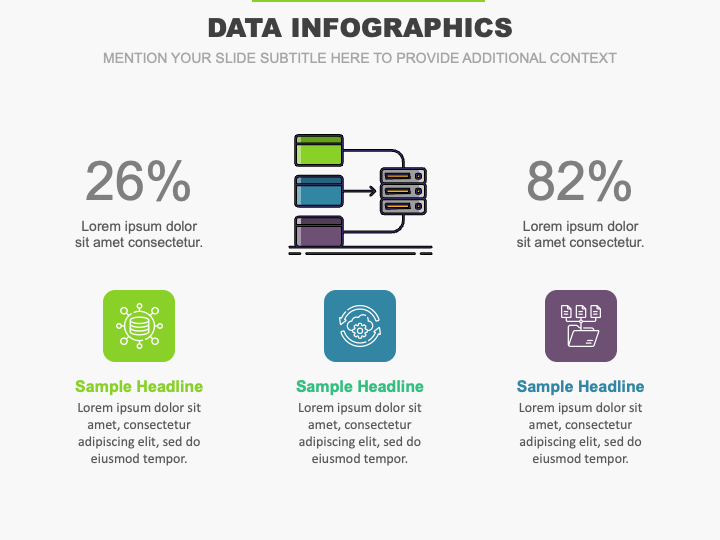
- An infographic of a server stack can be used to highlight the data storage and recovery process in servers.
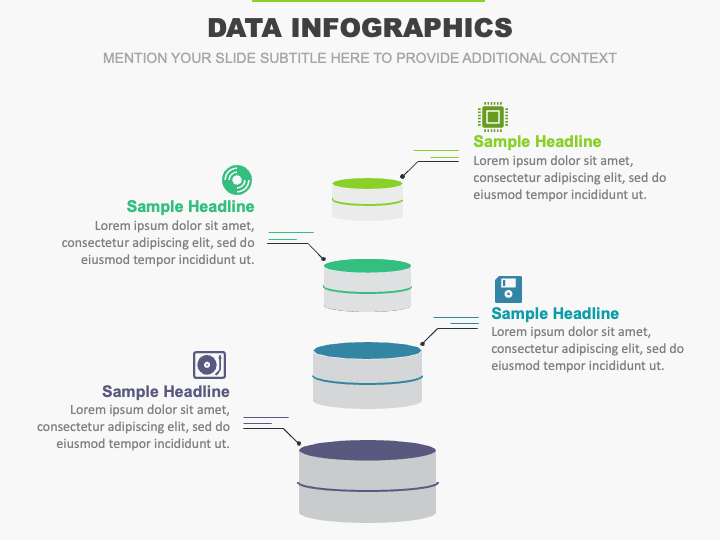
- One of the slides can be used to display the characteristics of data silos.
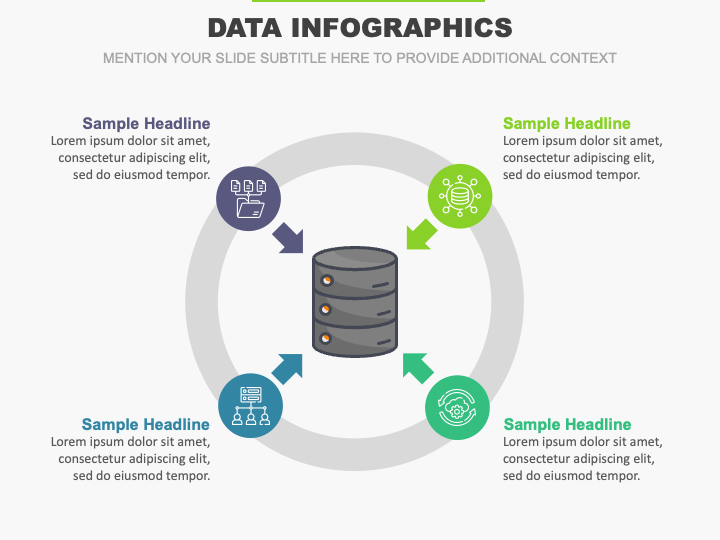
- The security concerns associated with the data stored in a physical server are represented via an infographic of servers.
- The best practices for data handling can be showcased with clarity.
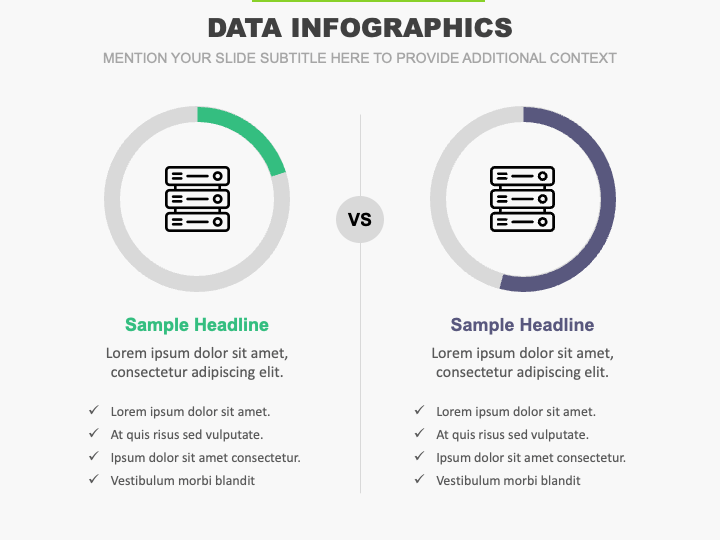
- You can exhibit the comparison of physical and cloud servers via a comparison illustration.
- The data transfer speed on different types of servers can be presented via an infographic of data transfer with percentage signs.
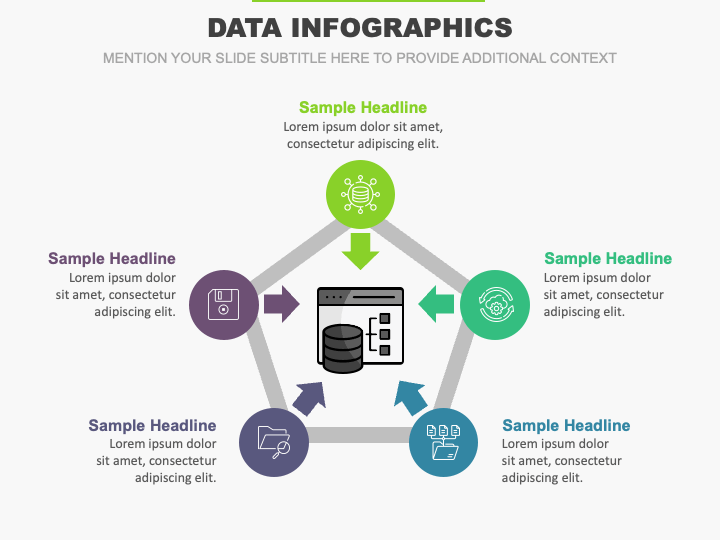
- The tactics for keeping the data stored in servers safe and secure can be highlighted via a pentagon-shaped illustration.
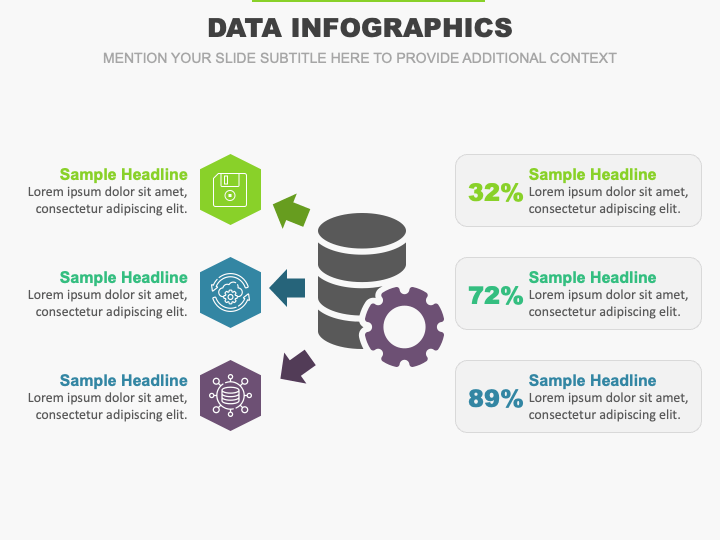
- Use the infographic of a data silo with a cogwheel to illustrate the percentage of inefficiencies caused by different data silos.
Features
- Entirely editable
- High-quality visuals
- Copyright-safe
- 24/7 customer support
Grab this PPT right away!
Write Your Own Review

Related Products


