

Key Observations PowerPoint and Google Slides Template
Key Observations PowerPoint and Google Slides Template
(10 Editable Slides)

Related Presentation Templates

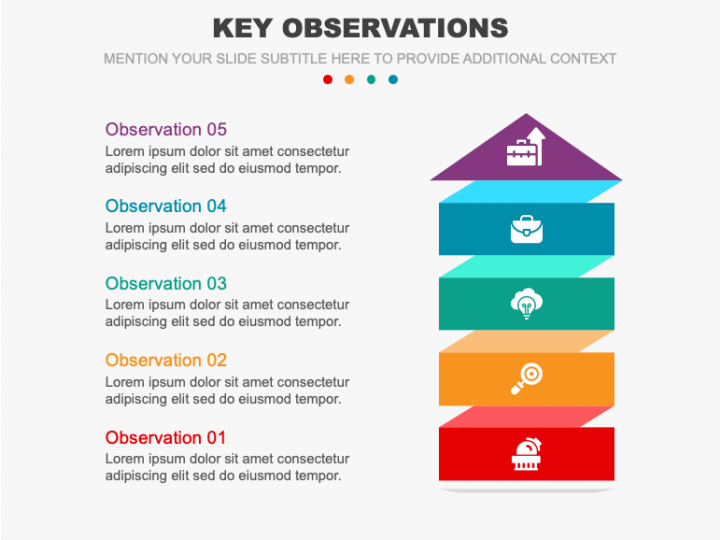
Lay your hands on our Key Observations for PowerPoint and Google Slides to give your presentations a touch of elegance and dynamism and drive maximum audience engagement. Business consultants and data analysts can highlight market trends, consumer behavior data, and other insights derived from data analysis. Researchers can use this template to visualize patterns in data, correlations between variables, statistical findings, survey results, performance metrics, etc. Educators can use this deck to communicate significant discoveries or conclusions from research projects or experiments. Additionally, you can highlight disease patterns, treatment outcomes, temperature trends, deforestation rates, and more.
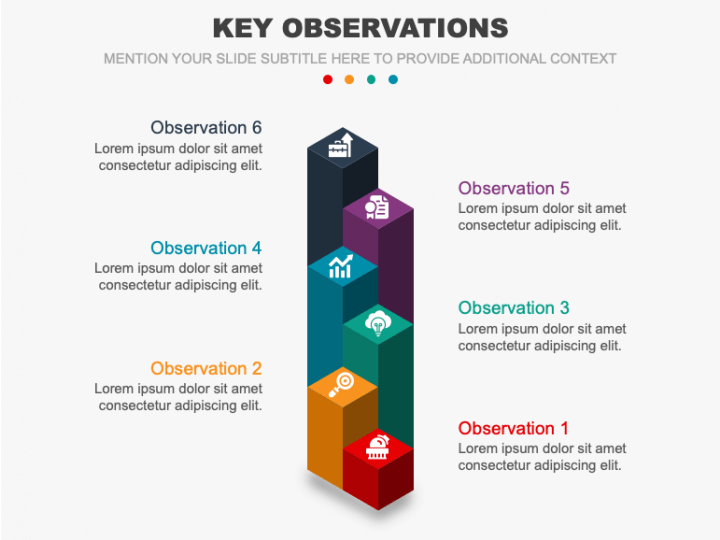
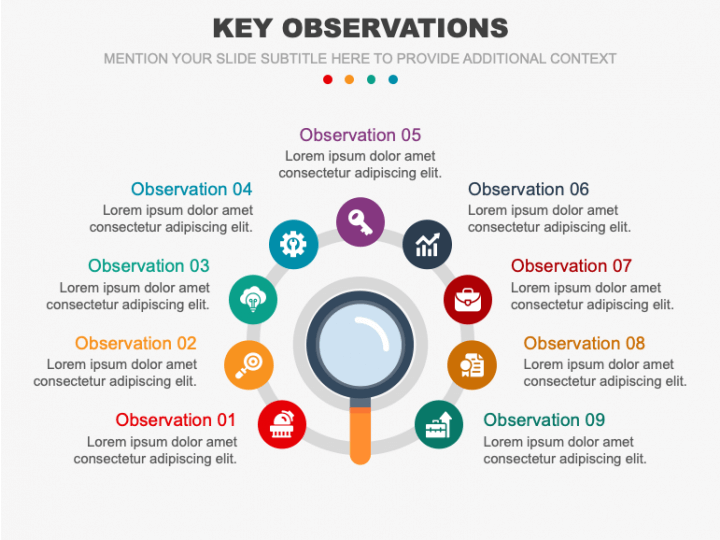
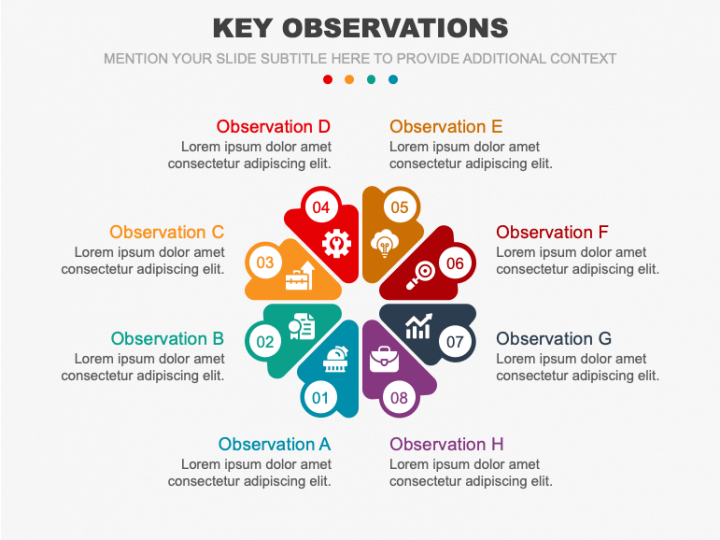
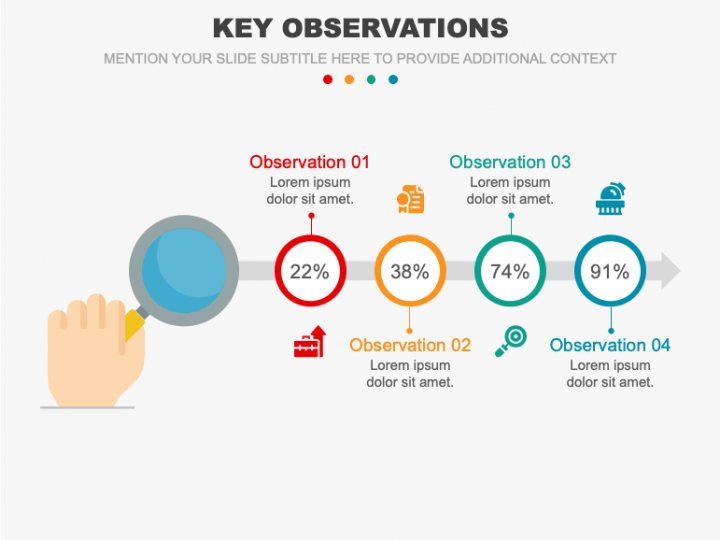
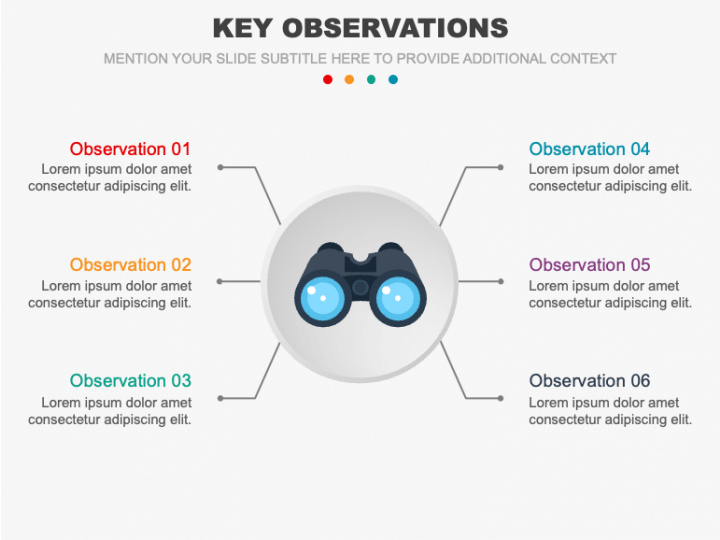
The slides showcase engaging visuals, including interconnected quadrilateral-shaped boxes, an upward-facing zigzag arrow, a bar graph, a magnifying glass, donut charts with percentage indicators, binoculars, and more. These visuals also feature compelling icons and striking contrasts to enhance the context of your observations. Each graphic offers enough space to incorporate your text.
Features
- You get complete freedom to mold the graphics according to your preferences.
- The visuals guarantee the same resolution, even when scaled to a bigger display.
- The design process involves thorough research to keep issues related to copyright breach incidents at bay.
Grab this PPT right away!