

Month Comparison PowerPoint and Google Slides Template
Month Comparison PowerPoint and Google Slides Template
(3 Editable Slides)
Related Presentation Templates
Download our Month Comparison template for PowerPoint and Google Slides to showcase complex textual information in easily digestible snippets and improve retention. Sales professionals can use this deck to showcase a comprehensive overview of the monthly sales, revenue, and profitability of an entity or product/service.
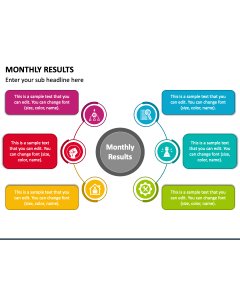
You can also use this set to display the months in which the targets were missed and achieved. Digital marketing professionals can highlight the quarter-wise data related to website traffic, page views, unique visitors, bounce rate, etc. Additionally, you can present the comparison of monthly customer feedback scores or ratings, social media engagement, and other trends, data, or statistics.
A Look at the Deck
The PPT boasts
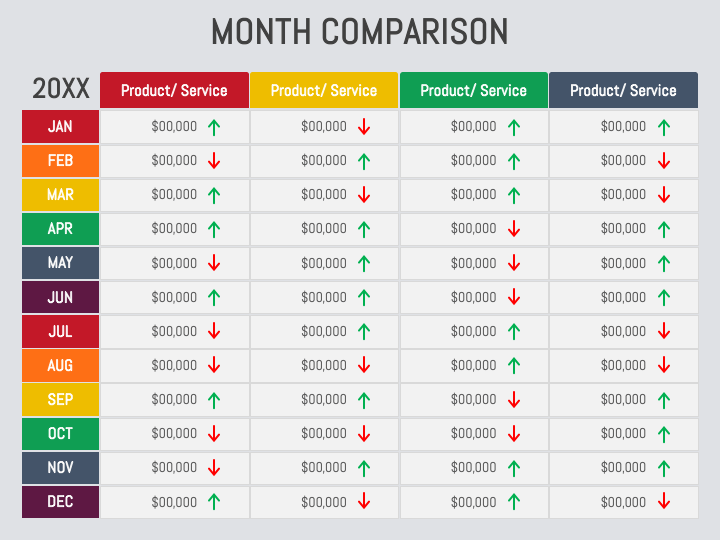
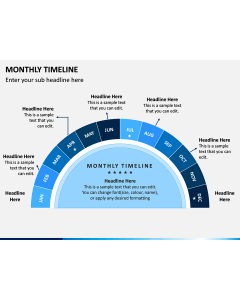
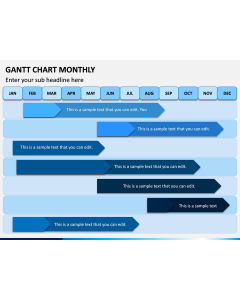
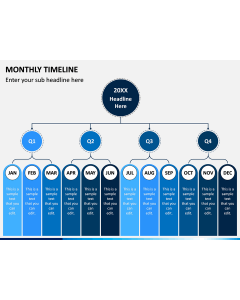
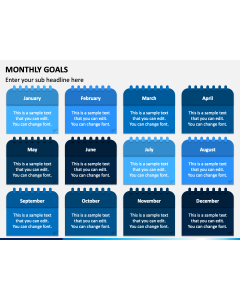
- A tabular infographic depicting month-wise comparison
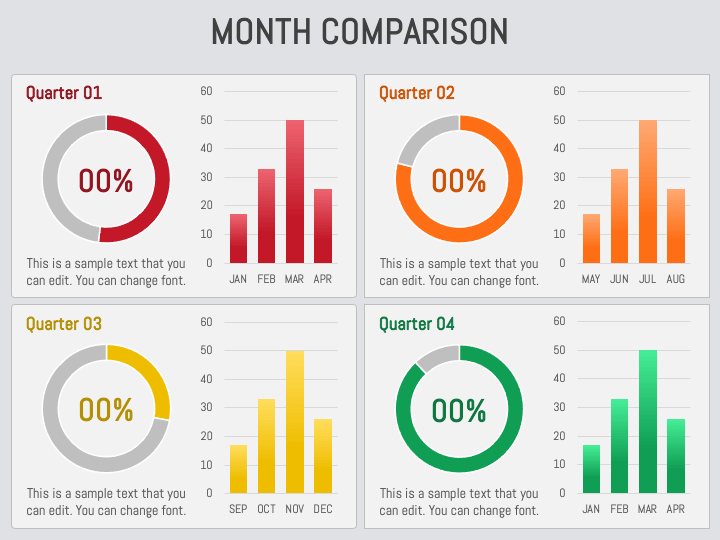
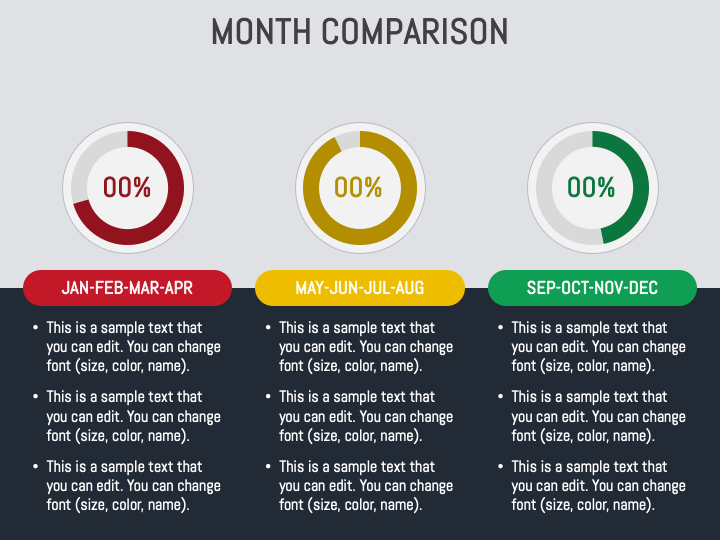
- A dashboard illustration with pie and bar charts showing quarter-wise comparison
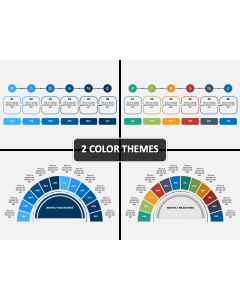
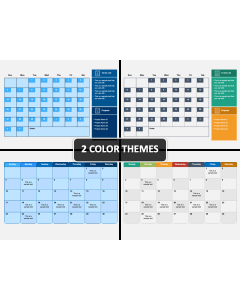
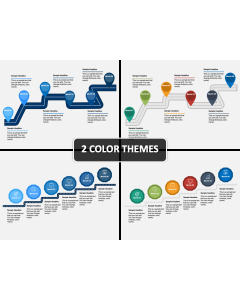
The visuals are adorned with vibrant color schemes and editable text placeholders, enabling presenters to make their presentations visually engaging.
Features
- Entirely editable graphics
- Copyright-safe
- Assured high-resolution infographics
- 24/7 customer support
- Reusable for a lifetime