

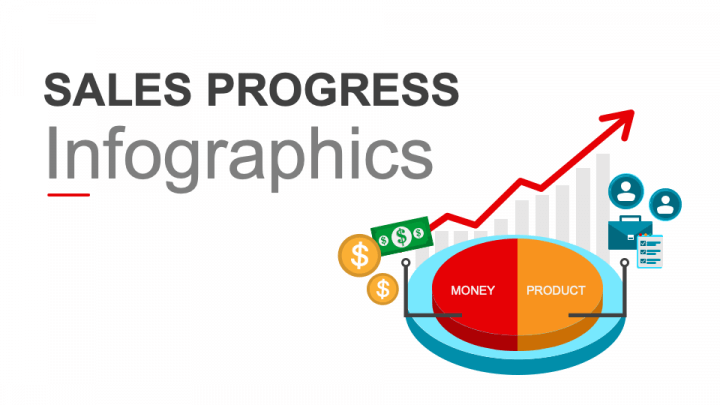
Sales Progress Infographics for PowerPoint and Google Slides
Sales Progress Infographics for PowerPoint and Google Slides
(14 Editable Slides)

Related Presentation Templates

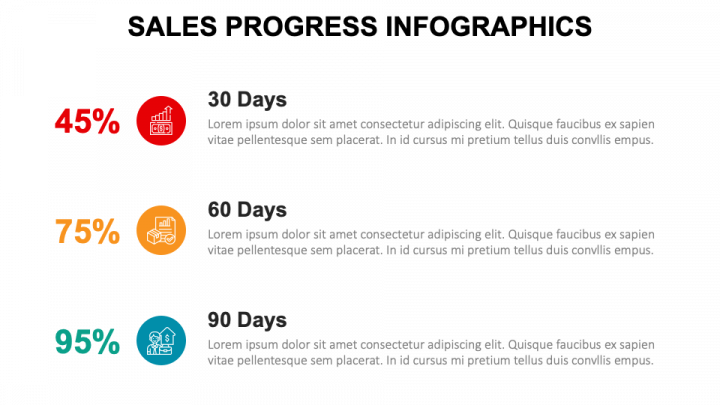
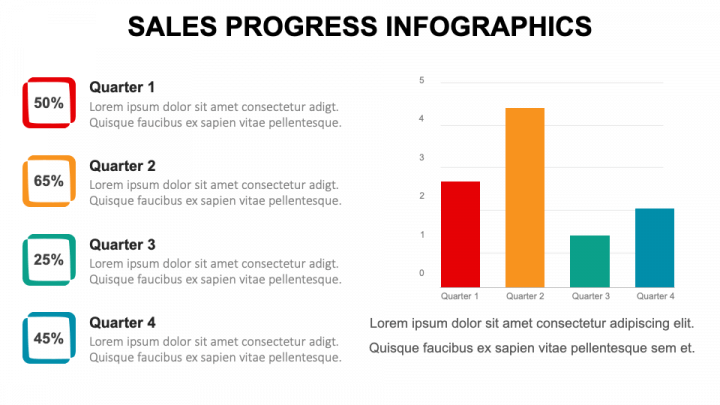
Download our Sales Progress Infographics for PowerPoint and Google Slides to present complex data and information in a crystal clear manner, fostering improved comprehension and long-term retention. Senior executives can illustrate the company’s sales performance over time, highlighting key metrics, in front of board members, investors, and other stakeholders. Sales professionals can use these high-definition visuals to showcase yearly, quarterly, and monthly revenue and sales growth to senior management. Sales representatives can visualize progress by comparing sales targets to actual results.
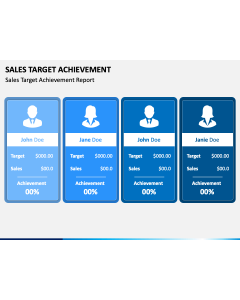
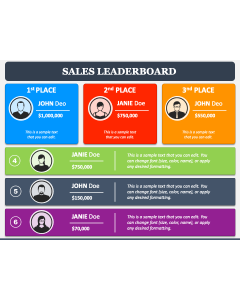
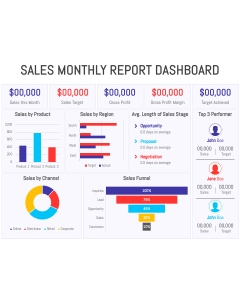
With these captivating infographics, you can depict progress in product or region-wise sales, sales cycle length, win-loss rate, individual representative performance, and more. Marketers can also demonstrate the impact of campaigns on lead generation and overall sales. Furthermore, you can shed light on the sales progress based on various other metrics in a visually engaging manner.
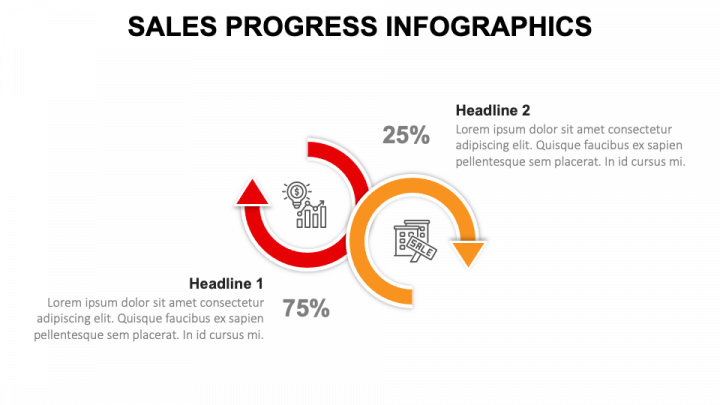
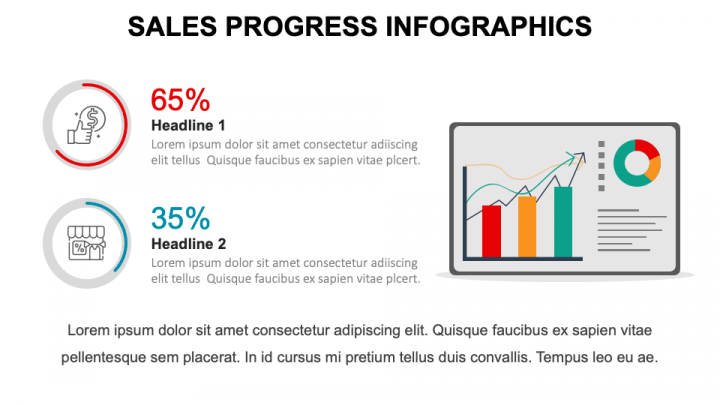
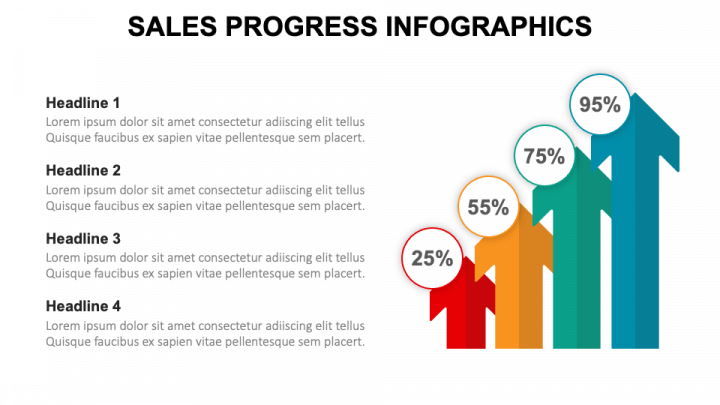
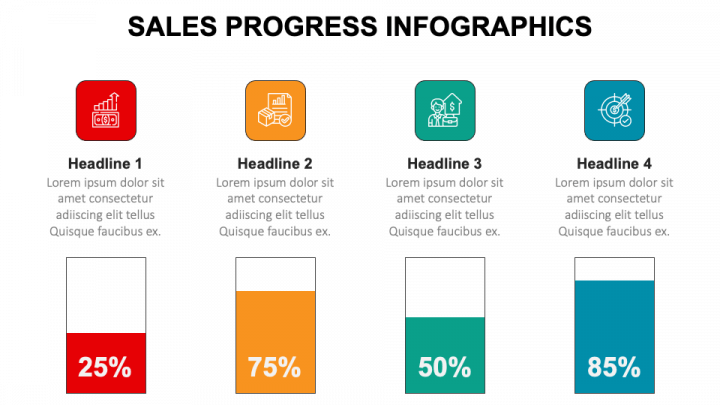
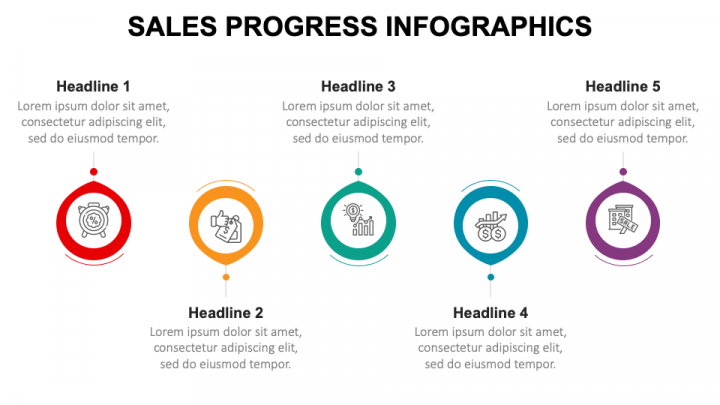
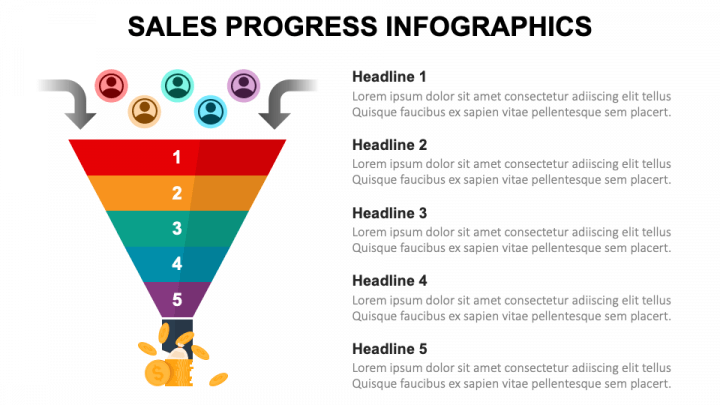
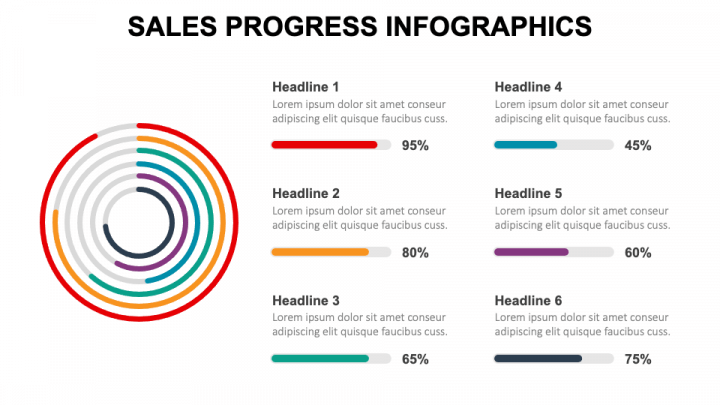
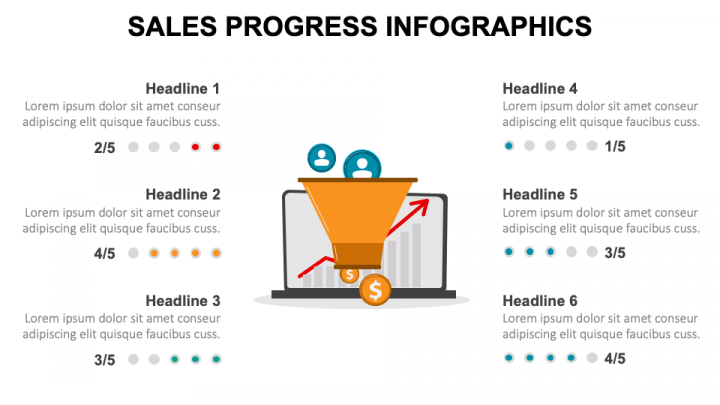
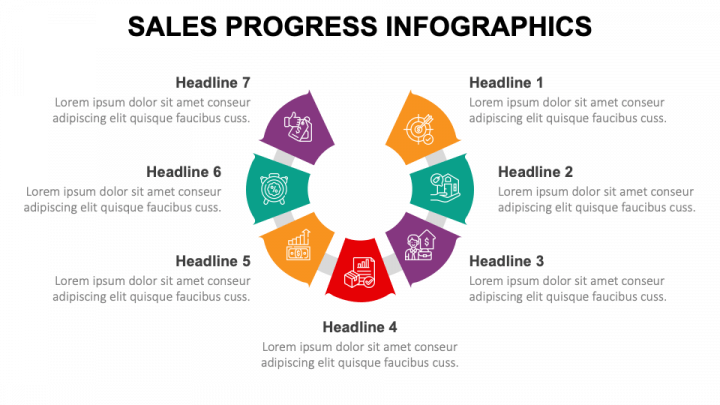
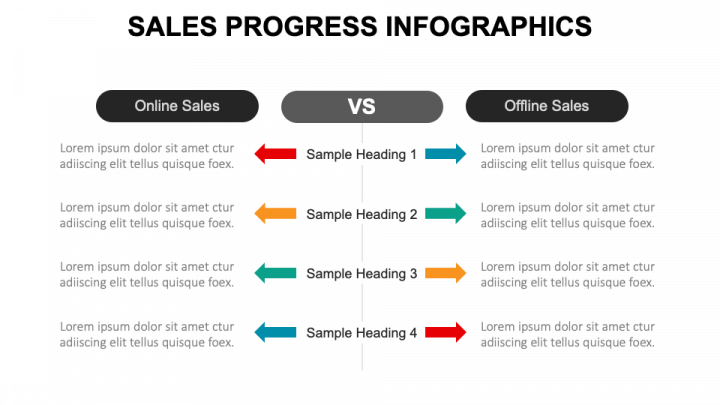
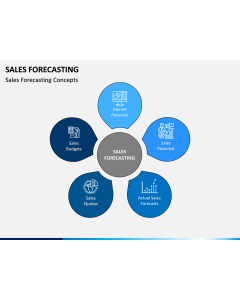
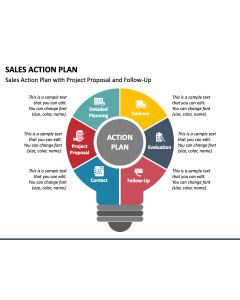
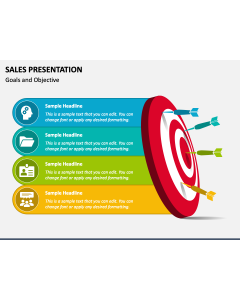
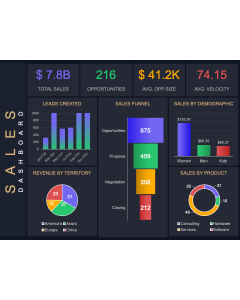
The slides feature eye-catching infographics, including a pie chart, two circular arrows with different percentages, donut charts, a bar graph, an arrow-shaped progressive bar chart, a funnel, a concentric circle, a laptop with a funnel, a comparison layout, and more. The bright color contrasts and self-explanatory icons will emphasize key data points, guiding the viewers’ attention.
Features
- You don’t require special editing tools or external assistance to make the desired changes to the deck.
- Each visual guarantees an uninterrupted resolution, regardless of screen dimensions.
- Our skilled designers have carefully designed the entire set to prevent copyright issues.
- Receive immediate assistance from our round-the-clock customer support team.
Grab this PPT without delay!