10x10 Table
10x10 Table
(1 Editable Slide)
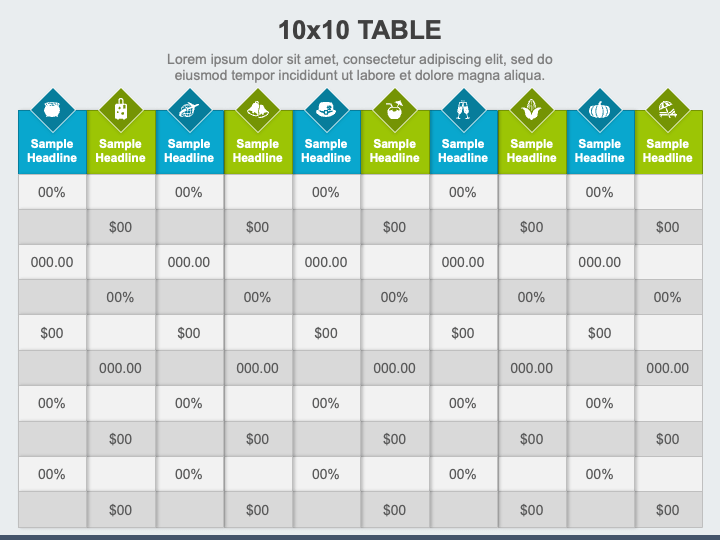


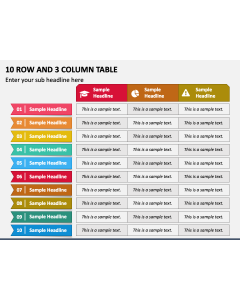
Get your hands on our 10x10 Table graphic for PowerPoint and Google Slides to give your complex data and textual information a clean and structured look. The slide features a tabular infographic of ten rows and ten columns adorned with appealing icons. The editable cells enable presenters to put the desired content.
Market researchers and analysts can use this graphic to illustrate the year-to-year comparison of a company’s performance, industry growth, and other key metrics. Business development and sales professionals can display the comparison of features and performance of products and services. Event managers can visualize a schedule of activities of an event. Surveyors can highlight survey or feedback data across different questions or aspects. You can also illustrate the budget or resource allocation across various areas and departments.
Features
- Easy customization
- Copyright-safe
- High-definition graphic
- 24/7 customer support
Download this PPT to enrich your presentations!