10x9 Table
10x9 Table
(1 Editable Slide)
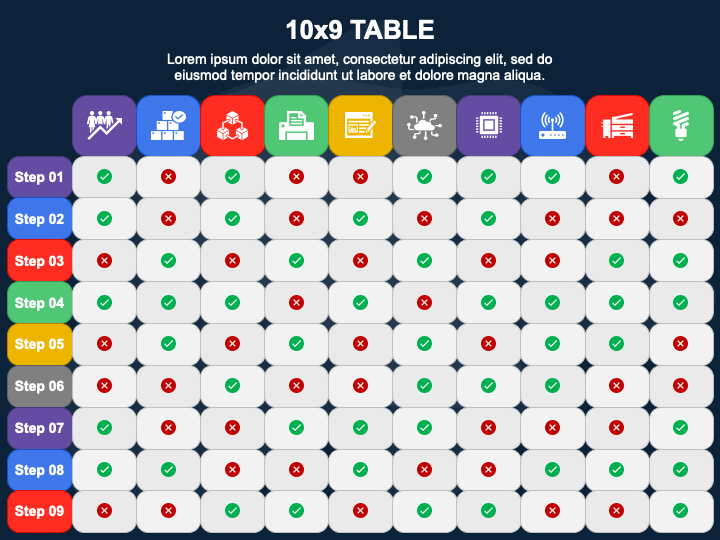
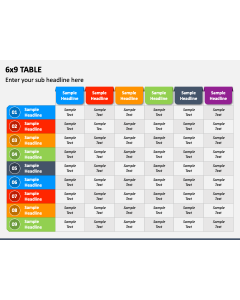
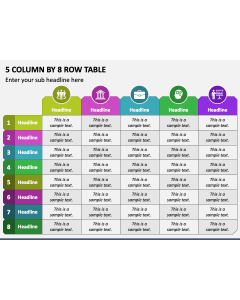
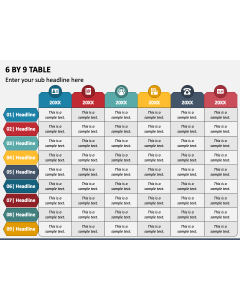
Leverage our 10x9 Table graphic for PowerPoint and Google Slides to display your complex textual information in a clear and structured manner. The slide boasts a tabular infographic adorned with stunning icons and right and wrong tick marks.
Product managers can leverage this illustration to highlight achieved and missed project milestones and deadlines, the completion status of various tasks, etc. Sales teams can display the sales data, including revenue, units sold, customer feedback, and more. Business development professionals can also depict the difference between the products and services of different brands based on the presence or absence of particular features or attributes. Additionally, marketing professionals can present the performance of various marketing campaigns, such as website traffic, click-through rates, conversion rates, ROI, and more.
Features
- You can quickly make the changes according to your preferences without special tools or external aid.
- You can scale the illustration on any screen size without disturbing the original resolution and quality.
- Our designers have crafted the infographic after thorough research to eliminate the room for copyright issues.
Get this PPT now!
