13 Sections Table
13 Sections Table
(1 Editable Slide)
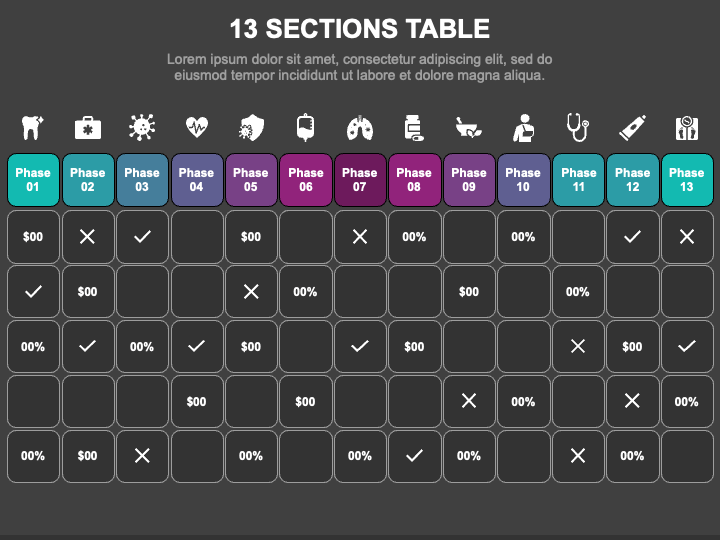


Download our 13 Sections Table graphic for PowerPoint and Google Slides to showcase your complex textual information with clarity and style. The slide comprises a tabular infographic of thirteen columns adorned with a dark backdrop and appealing icons. Editable text placeholders are provided to help you put the desired content.
Business leaders can use this graphic in their presentations to depict a holistic overview of their company’s performance, including key metrics, financial highlights, and goals over a specific period. Market analysts can use this graphic to illustrate market trends, competitive analysis, consumer insights, and more in a visually engaging manner. This editable illustration is also ideal for showcasing project task status, social media performance, workforce analytics, etc.
Features
- Resizing and recoloring the graphic to suit your preferences is an effortless process.
- You can project the infographic on any screen size without disturbing the optical resolution.
- Our designers have crafted the illustration after extensive research to eliminate the room for copyright issues.
Download this PPT to infuse elegance and professionalism into your presentations!