6x10 Table
6x10 Table
(1 Editable Slide)
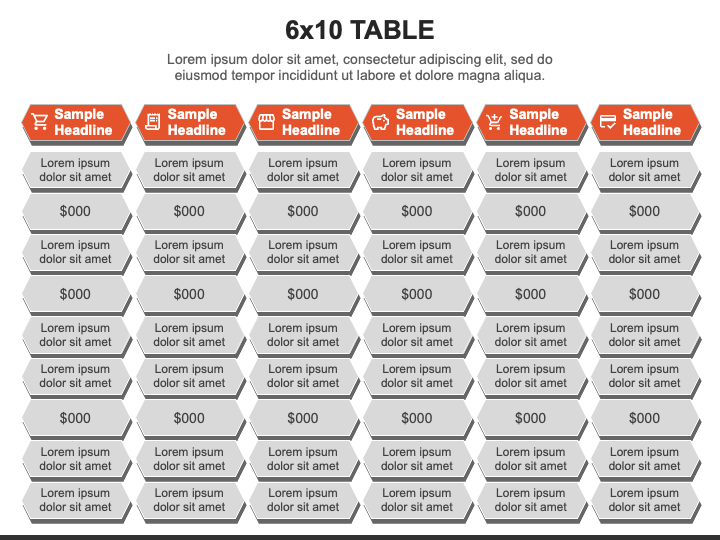
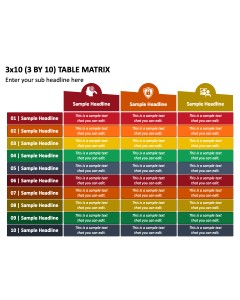
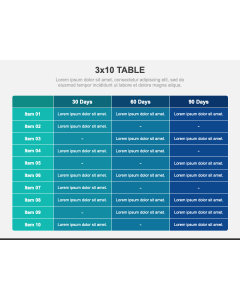
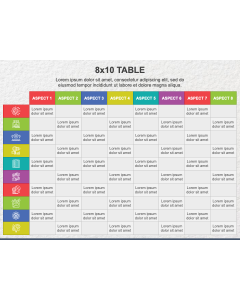
Download our 6x10 Table graphic for PowerPoint and Google Slides to add a vibrant touch to your presentations and ensure easy comprehension. The slide features a tabular infographic of ten rows and six columns. Each cell has sufficient space for text insertion.
Sales professionals can use this layout to highlight sales figures, targets, and other performance metrics for different products or regions. Financial experts can illustrate a financial overview of the company, including revenues, expenses, and profits over a specific period. You can also depict tax rates for individuals, partnerships, companies, NGOs, etc., highlighting standard deductions, tax percentages, and more. Digital marketing experts can visualize the content release schedules. Further, various concepts can be presented, such as training program schedules, survey results, quality metrics, product feature comparisons, etc.
Features
- You won’t experience the challenges or restrictions while making the changes in the illustration.
- The quality and clarity won’t get disturbed, even when projected on a widescreen.
- Our designers have carefully crafted the graphic to ensure no user experiences copyright issues.
Download this PPT to add creativity to your presentations!
