
Headcount Dashboard for PowerPoint and Google Slides
(1 Editable Slide)

Headcount Dashboard for PowerPoint and Google Slides

SB16506
Available For


Similar Products
-

- Sale
- Sale
- Sale
- Sale
- Sale


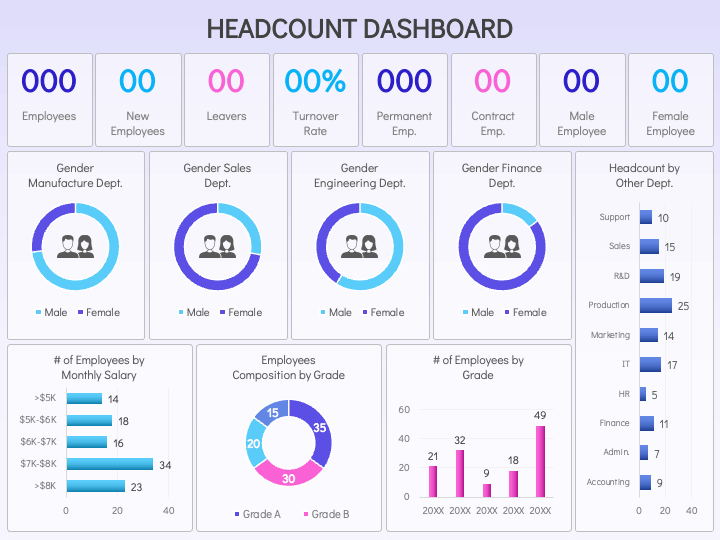
We have introduced the Headcount Dashboard slide for PowerPoint and Google Slides to help you showcase workforce-related metrics with clarity and impact. The slide comprises a dashboard infographic representing donut charts, bar graphs, and more. As this dashboard slide is linked with Excel, it will get automatically updated when you make changes to the Excel data.
HR executives can highlight the employee count changes in the workplace over time, the breakdown of teams based on age, gender, and ethnicity distribution, turnover rates, etc. Financial professionals can visualize total labor costs, cost per employee, and more. Consultants can describe how gaining insights about the state of the workforce helps identify areas for strategic workforce planning. Business experts and senior executives can explain the impact of headcount changes on business operations.
Features
- You can make multiple edits in the slide to match your presentation’s theme without restrictions.
- The graphic quality won’t get disturbed, even when projected on a widescreen.
- Our designers have crafted the illustration from scratch to eliminate the room for copyright issues.
Download this PPT slide to make your presentations stand out!
Write Your Own Review

Related Products


