Learning Curve PowerPoint and Google Slides Template
(10 Editable Slides)
Learning Curve PowerPoint and Google Slides Template
Available For
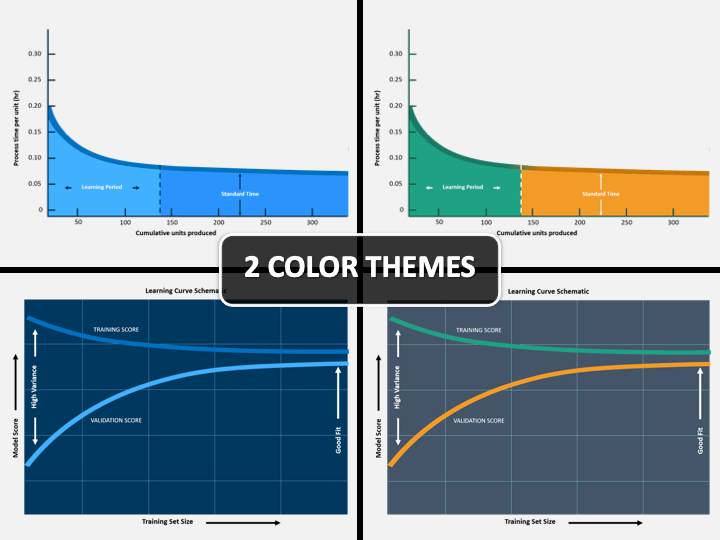
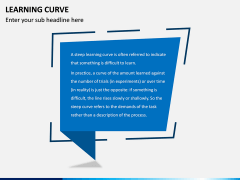
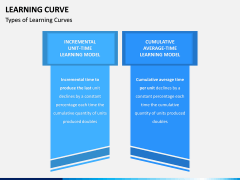
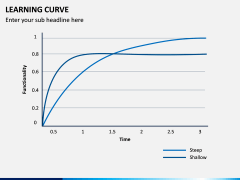
Our pool of knowledge is supposed to expand with time. Learning in the right direction helps us in our growth and brings clarity. This is commonly called a curve of learning versus time. On a graph, a curve can take different projections such as steep and shallow, with different interpretations. Our learning curve PowerPoint template helps in explaining the real-world dynamics of learning. The high-definition, fully editable PPT will prove pretty resourceful for your team/company in all areas of learning and assessment for business growth.
Learn better, learn solid
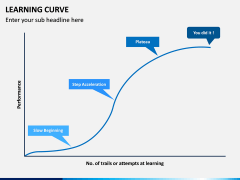
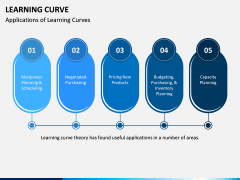
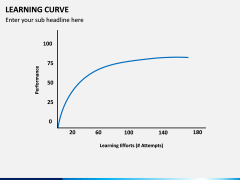
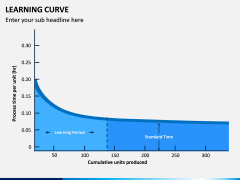
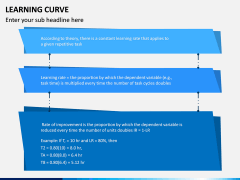
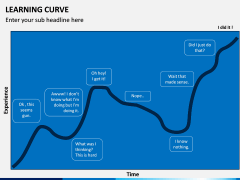
Depicted on a graph with a vertical and horizontal axis, a learning curve basically indicates progress. Naturally, initial learning for any substantial subject is slow; over time, it begins to catch speed and then gains momentum. This learning curve PPT lets you and your audience open talk on each step of the curve. The set also puts forwards numerous areas where your company can benefit from, with the application of apt learning curve. Such as manpower scheduling, budgeting, negotiated buying, product pricing, and capacity planning, etc.
Download and begin customizing
Our professional graphic designers have created this template keeping in mind all your possible presentational needs. From presenting customized versions of the same template to various audiences or addressing in long or shortly timed sessions, you are covered. The entire presentation template is visually vector-based. This feature lets you modify any of the graphical elements without disturbing the high-definition quality offered. You can easily rescale, reshape, recolor, remove or move the objects, icons, designs, etc., with just basic skills.
Everything you need, find it here
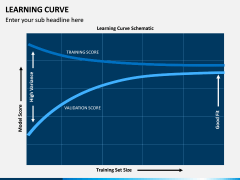
Besides tweaking graphics, you can also rework the textual content. Edit or add any information you think is important for the upcoming audience. Your class will also get familiar with different kinds of graphs by the end of the slideshow. The well-researched and well-compiled set covers significant concepts such as variance, validation, training, performance, valleys, and plateaus of learning, etc. So just place in your sub-headlines, make necessary changes, and you are good to go!
Display on different platforms
Analysts, professors, teachers, students, company professionals invested in strategic marketing, sales planning, business owners, managers and supervisors, trainers and coaches, etc., all will find this set advantageous. So, save your sweat on creating an impactful PPT design. And also, get to play the slides on Apple Keynote and Google Slides.

