

Scatter Plot for PowerPoint
Scatter Plot for PowerPoint
(7 Editable Slides)


(7 Editable Slides)
Related Presentation Templates
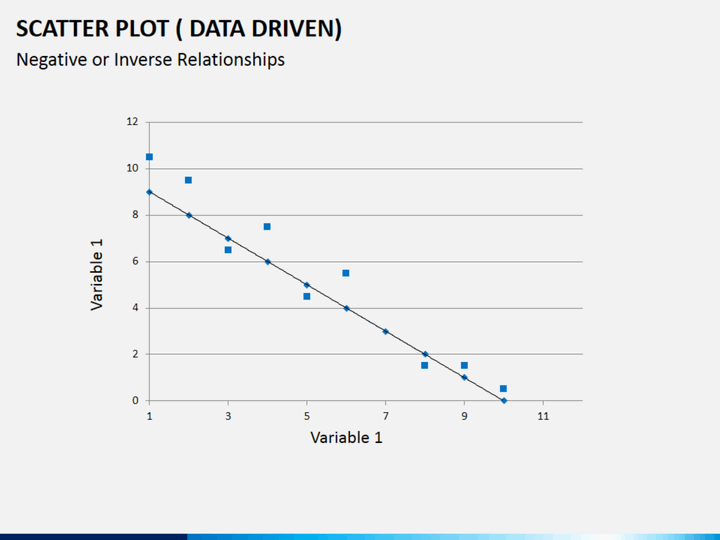
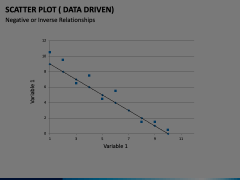
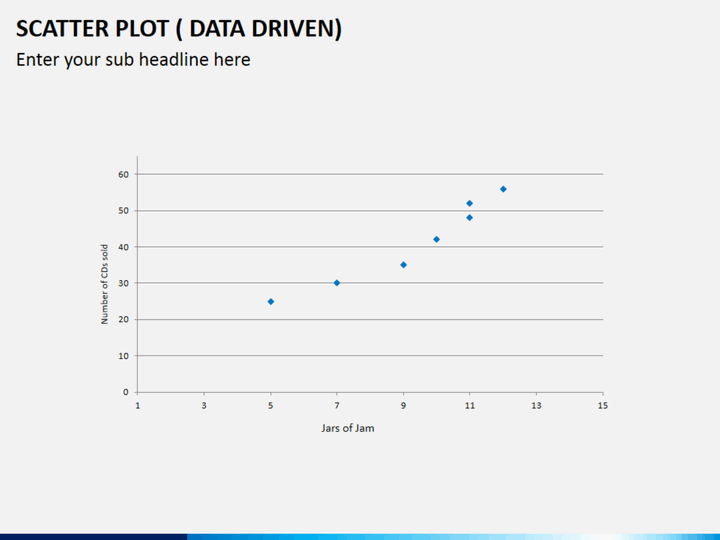
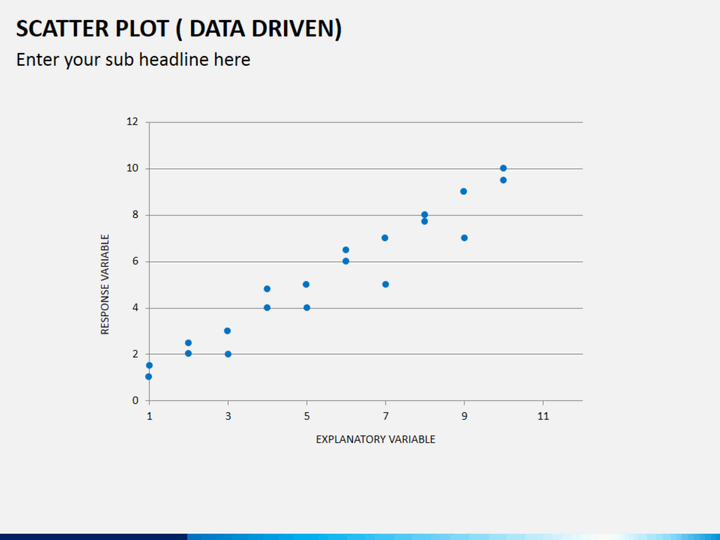
Scatter Plot is undoubtedly one of the best ways to depict a relationship between two or more variables. Mostly, the plot consists of two parameters that are represented by different axis. The graph represents a relationship between these variables on the basis of the provided data. The scatter plot diagram is mostly drawn between two variables, but sometimes, it can also have three or more parameters to compare. This makes easier for us to draw comparisons or study what kind of relationship exists between different variables.
Since the plot has such a universal appeal, it is used by individuals belonging to all sorts of domains. From students to researchers and scientists to working professionals, everyone can take the assistance of this fully editable Scatter Plot PowerPoint template to represent a relationship between different variables. Even though the plot depicts a relationship between various parameters, in some cases, it is also used to study the change or predict future response as well. It doesn’t matter what kind of data you wish to represent, you can easily make it happen by taking the assistance of this professionally designed template.
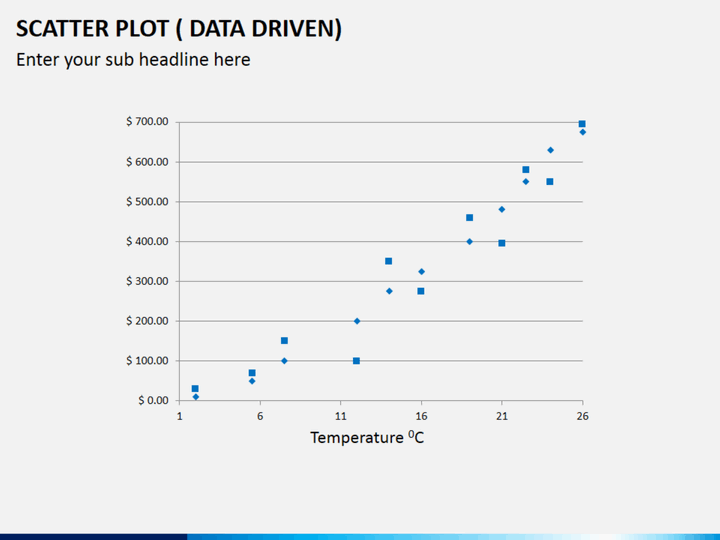
The set consists of a wide range of graphs of different kinds that will certainly save your time and efforts. You can simply use the graph of your choice and alter it with respect to your own data. We have come up with numerous variations of the plot in this set that can readily be used the way you like. In this way, you can compare different variables and study the relationship between them without any trouble.
Easy to download and edit, it is a must-have set for every individual who needs to compare different variables on a frequent basis. Since it is an entirely editable template, you can easily customize it and provide your own information with a single click. In no time, you would be able to alter these charts and include them in your slideshows. Not only it will save your time, but it will also make your PPT slides visually appealing. You would be able to use the set as a perfect visual aid, making it easier for your audience to remember your slideshow in the long run.