9 Columns Table
9 Columns Table
(1 Editable Slide)
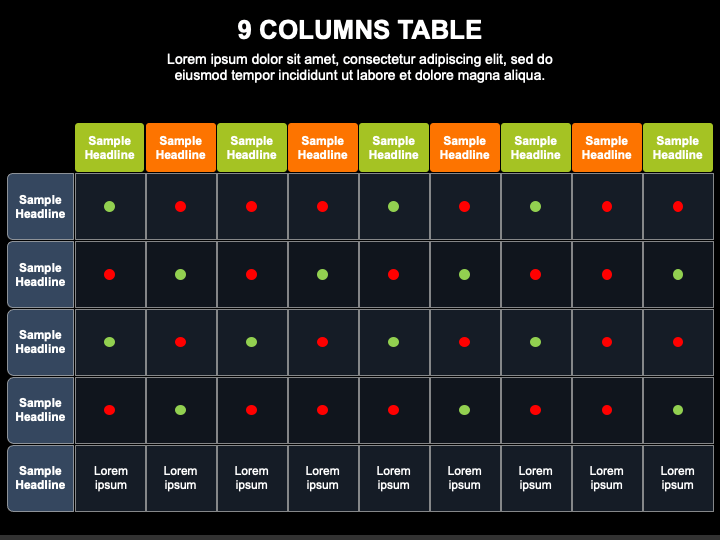
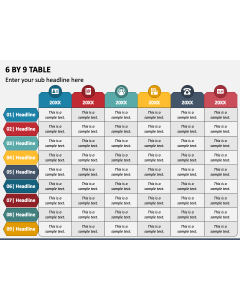
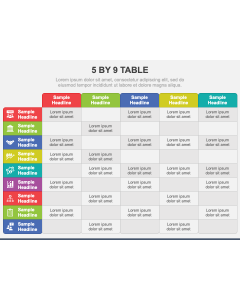
Download our 9 Columns Table slide for PowerPoint and Google Slides to add an aesthetic touch to your presentations and a visual perspective to your content. The slide features a tabular infographic with a dark backdrop, compelling icons, and red and green dots. Each cell is entirely editable.
Project managers can use this illustration to display the project status, including the tasks that are behind the schedule, on track, or completed. Business analysts can highlight positive and negative trends in revenue, expenses, profits, etc. Risk management experts can make the most of the graphic to portray the severity of risks in a project or business. Surveyors can depict survey data, indicating positive with green and negative responses with red dots. Sales managers can display the team performance, indicating which team members have achieved and missed the targets. Additionally, the illustration can be used to display the comparative analysis of multiple product and service offerings, financial performance over a specific period, etc.
Features
- Conveniently alter the illustration to match your presentation’s theme.
- You can project the infographic to any screen without disturbing the original resolution.
- Our designers have thoughtfully crafted the set to eliminate the room for copyright issues.
Grab this PPT to boost your presentation’s visual appeal!
